
AND THE WINNER IS: RED OAK
In a Googled world, The Harvard Forest is the land of the long view, the deep dive, a place where researchers look up close at the landscape and its history, to see what the trees can teach. So it is that Audrey Barker Plotkin and I recently went out to take a look at what she had learned at Walter Lyford’s plot.
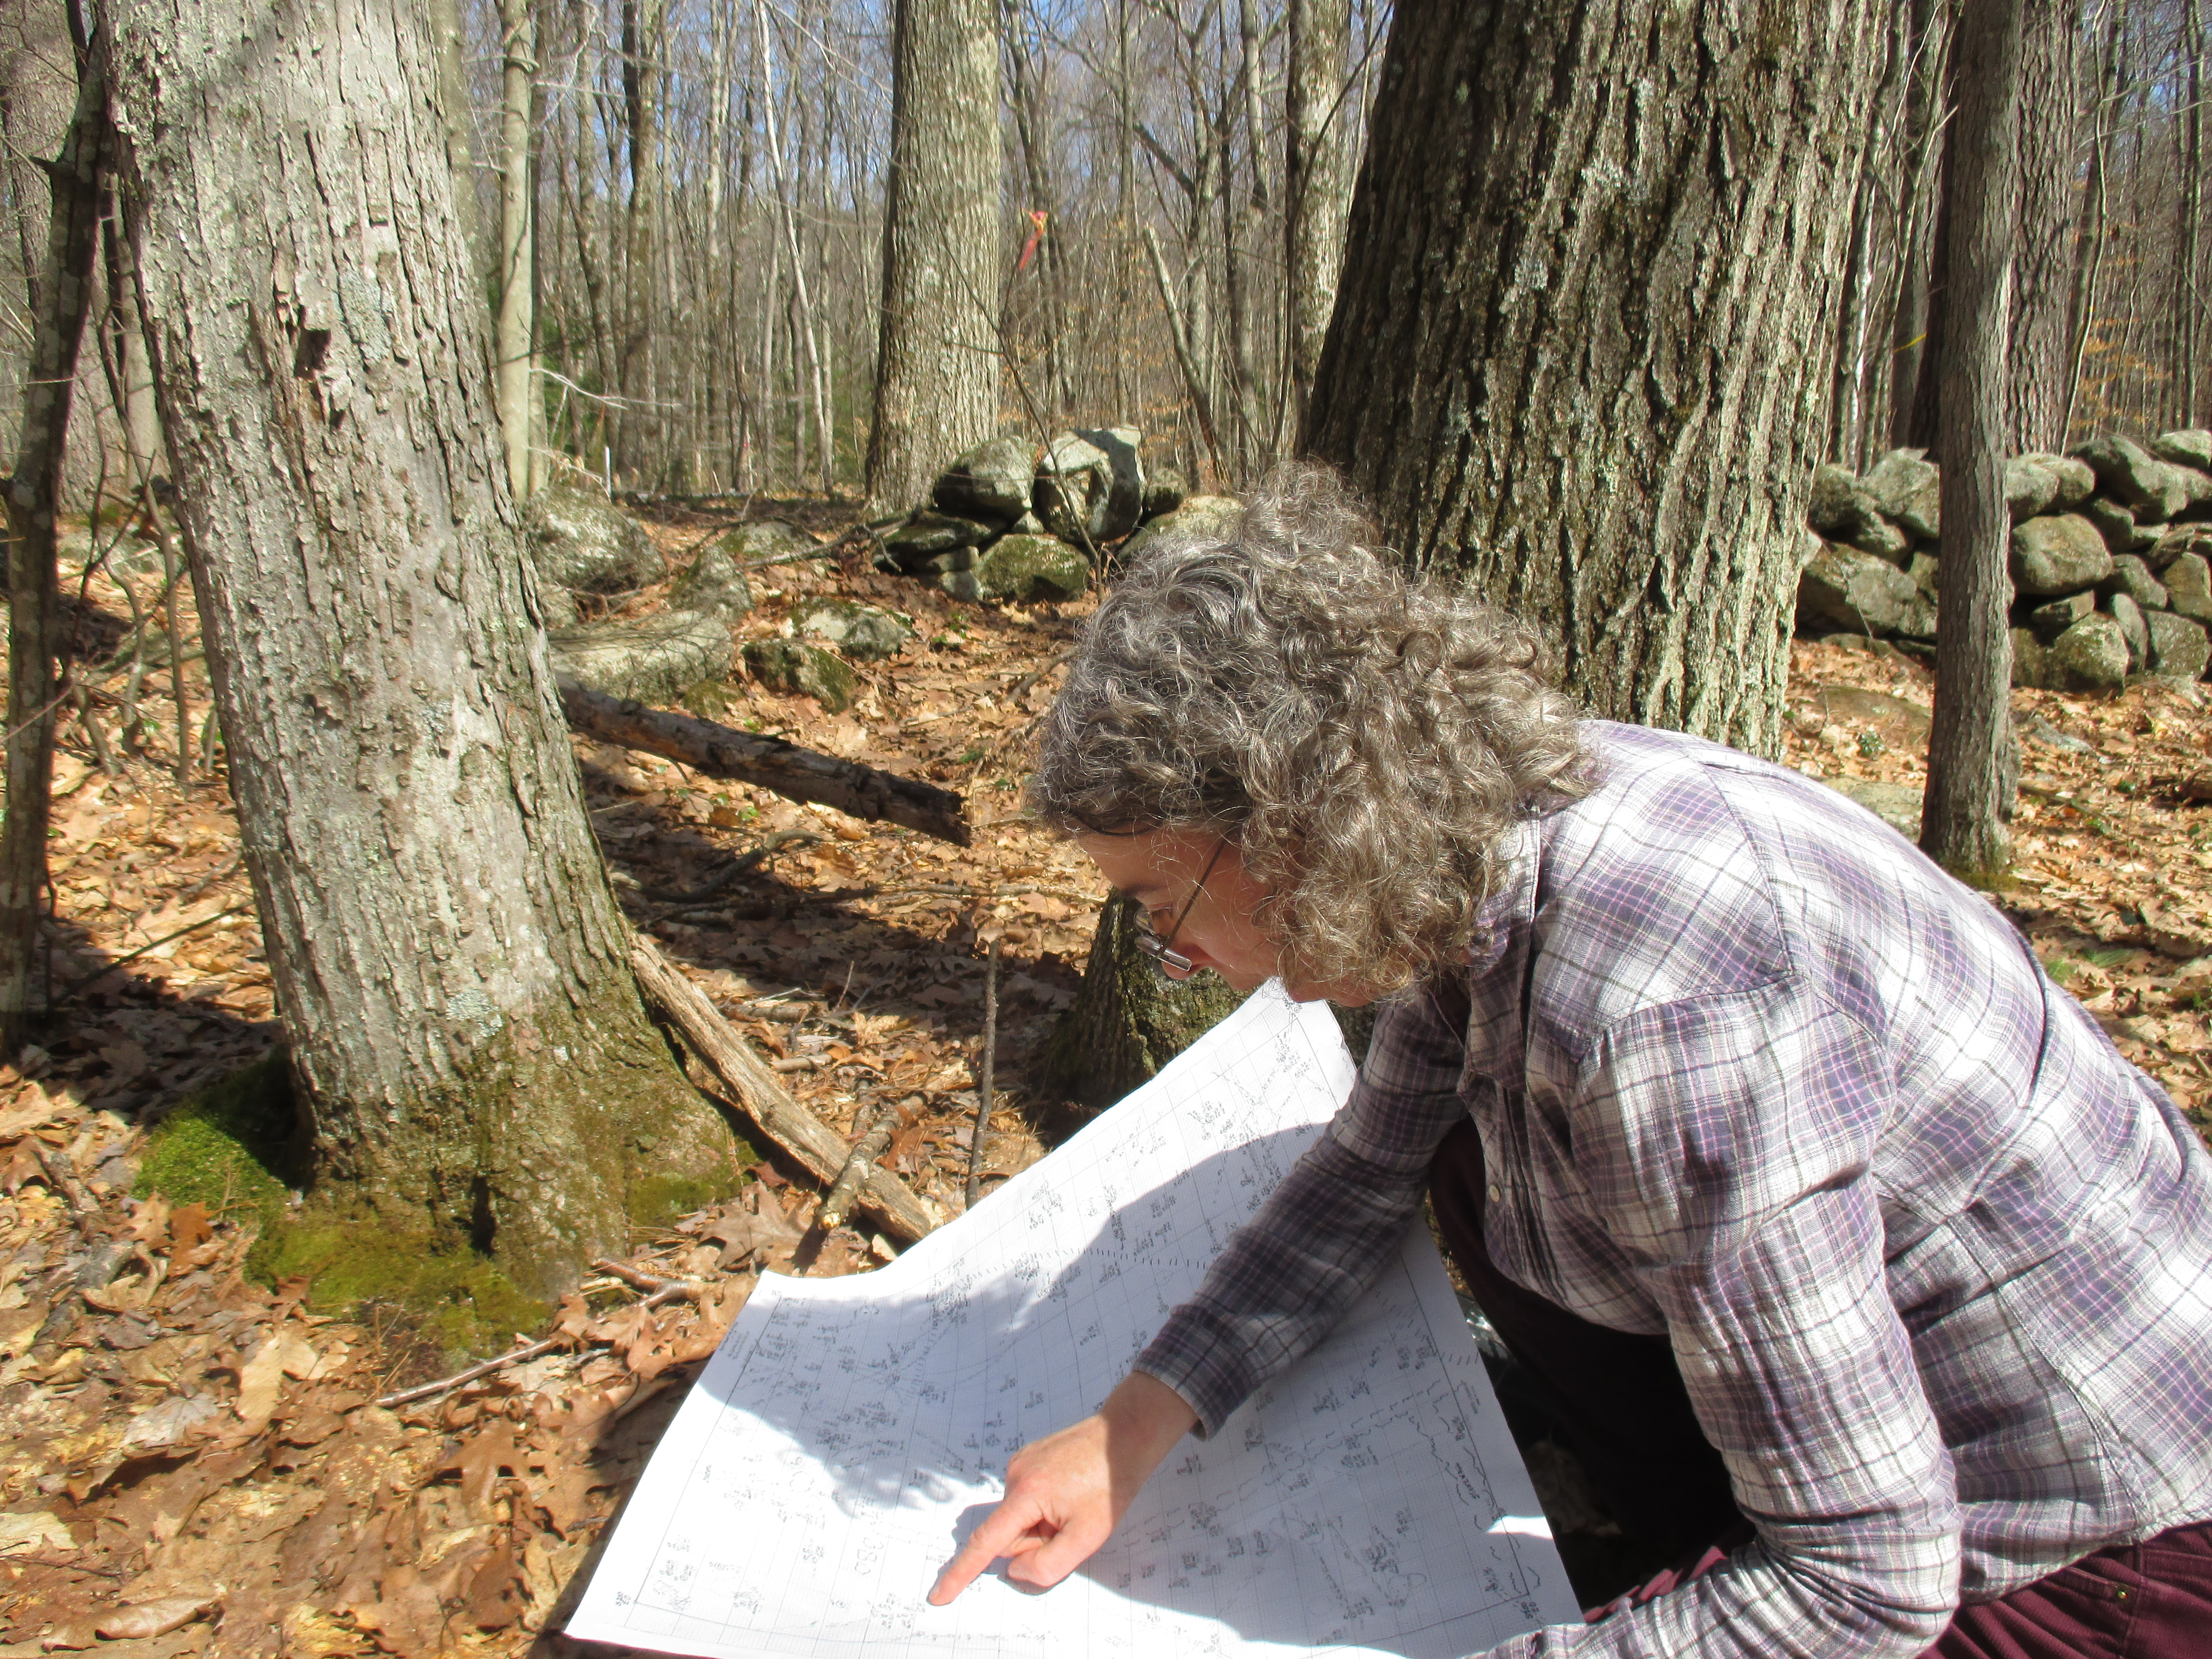
Audrey Barker Plotkin locates the red maple, left, and red oak, right, depicted on Lyford’s hand-drawn map. Unique, long term data sets are a hallmark of the Harvard Forest’s scholarship.
Lyford was a meticulous soil scientist at the Harvard Forest, a 3,700 acre research forest in Petersham, MA and a department of Harvard University. He established a permanent 7 acre plot at the Harvard Forest in 1969, where he measured and located every tree over two inches in diameter on a hand-drawn map — 6,000 trees in all. This beautiful, large-scale map is preserved at the Harvard Forest Archives today. It includes every feature on the forest floor in the plot: live and dead trees, stonewalls, boulders, and more.
Barker Plotkin, research manager at the Harvard Forest and her collaborators have been considering the 42 years of monitoring data accrued by now in five surveys of the plot, including the most recent, in 2011. What they found was new relevance in old data, because of the point of comparison Lyford’s baseline provides in a changing world. Since the plot was first laid out in 1969 much has happened – including the acceleration of climate change, and atmospheric levels of carbon dioxide causing it. It’s a change you can see in the trees.
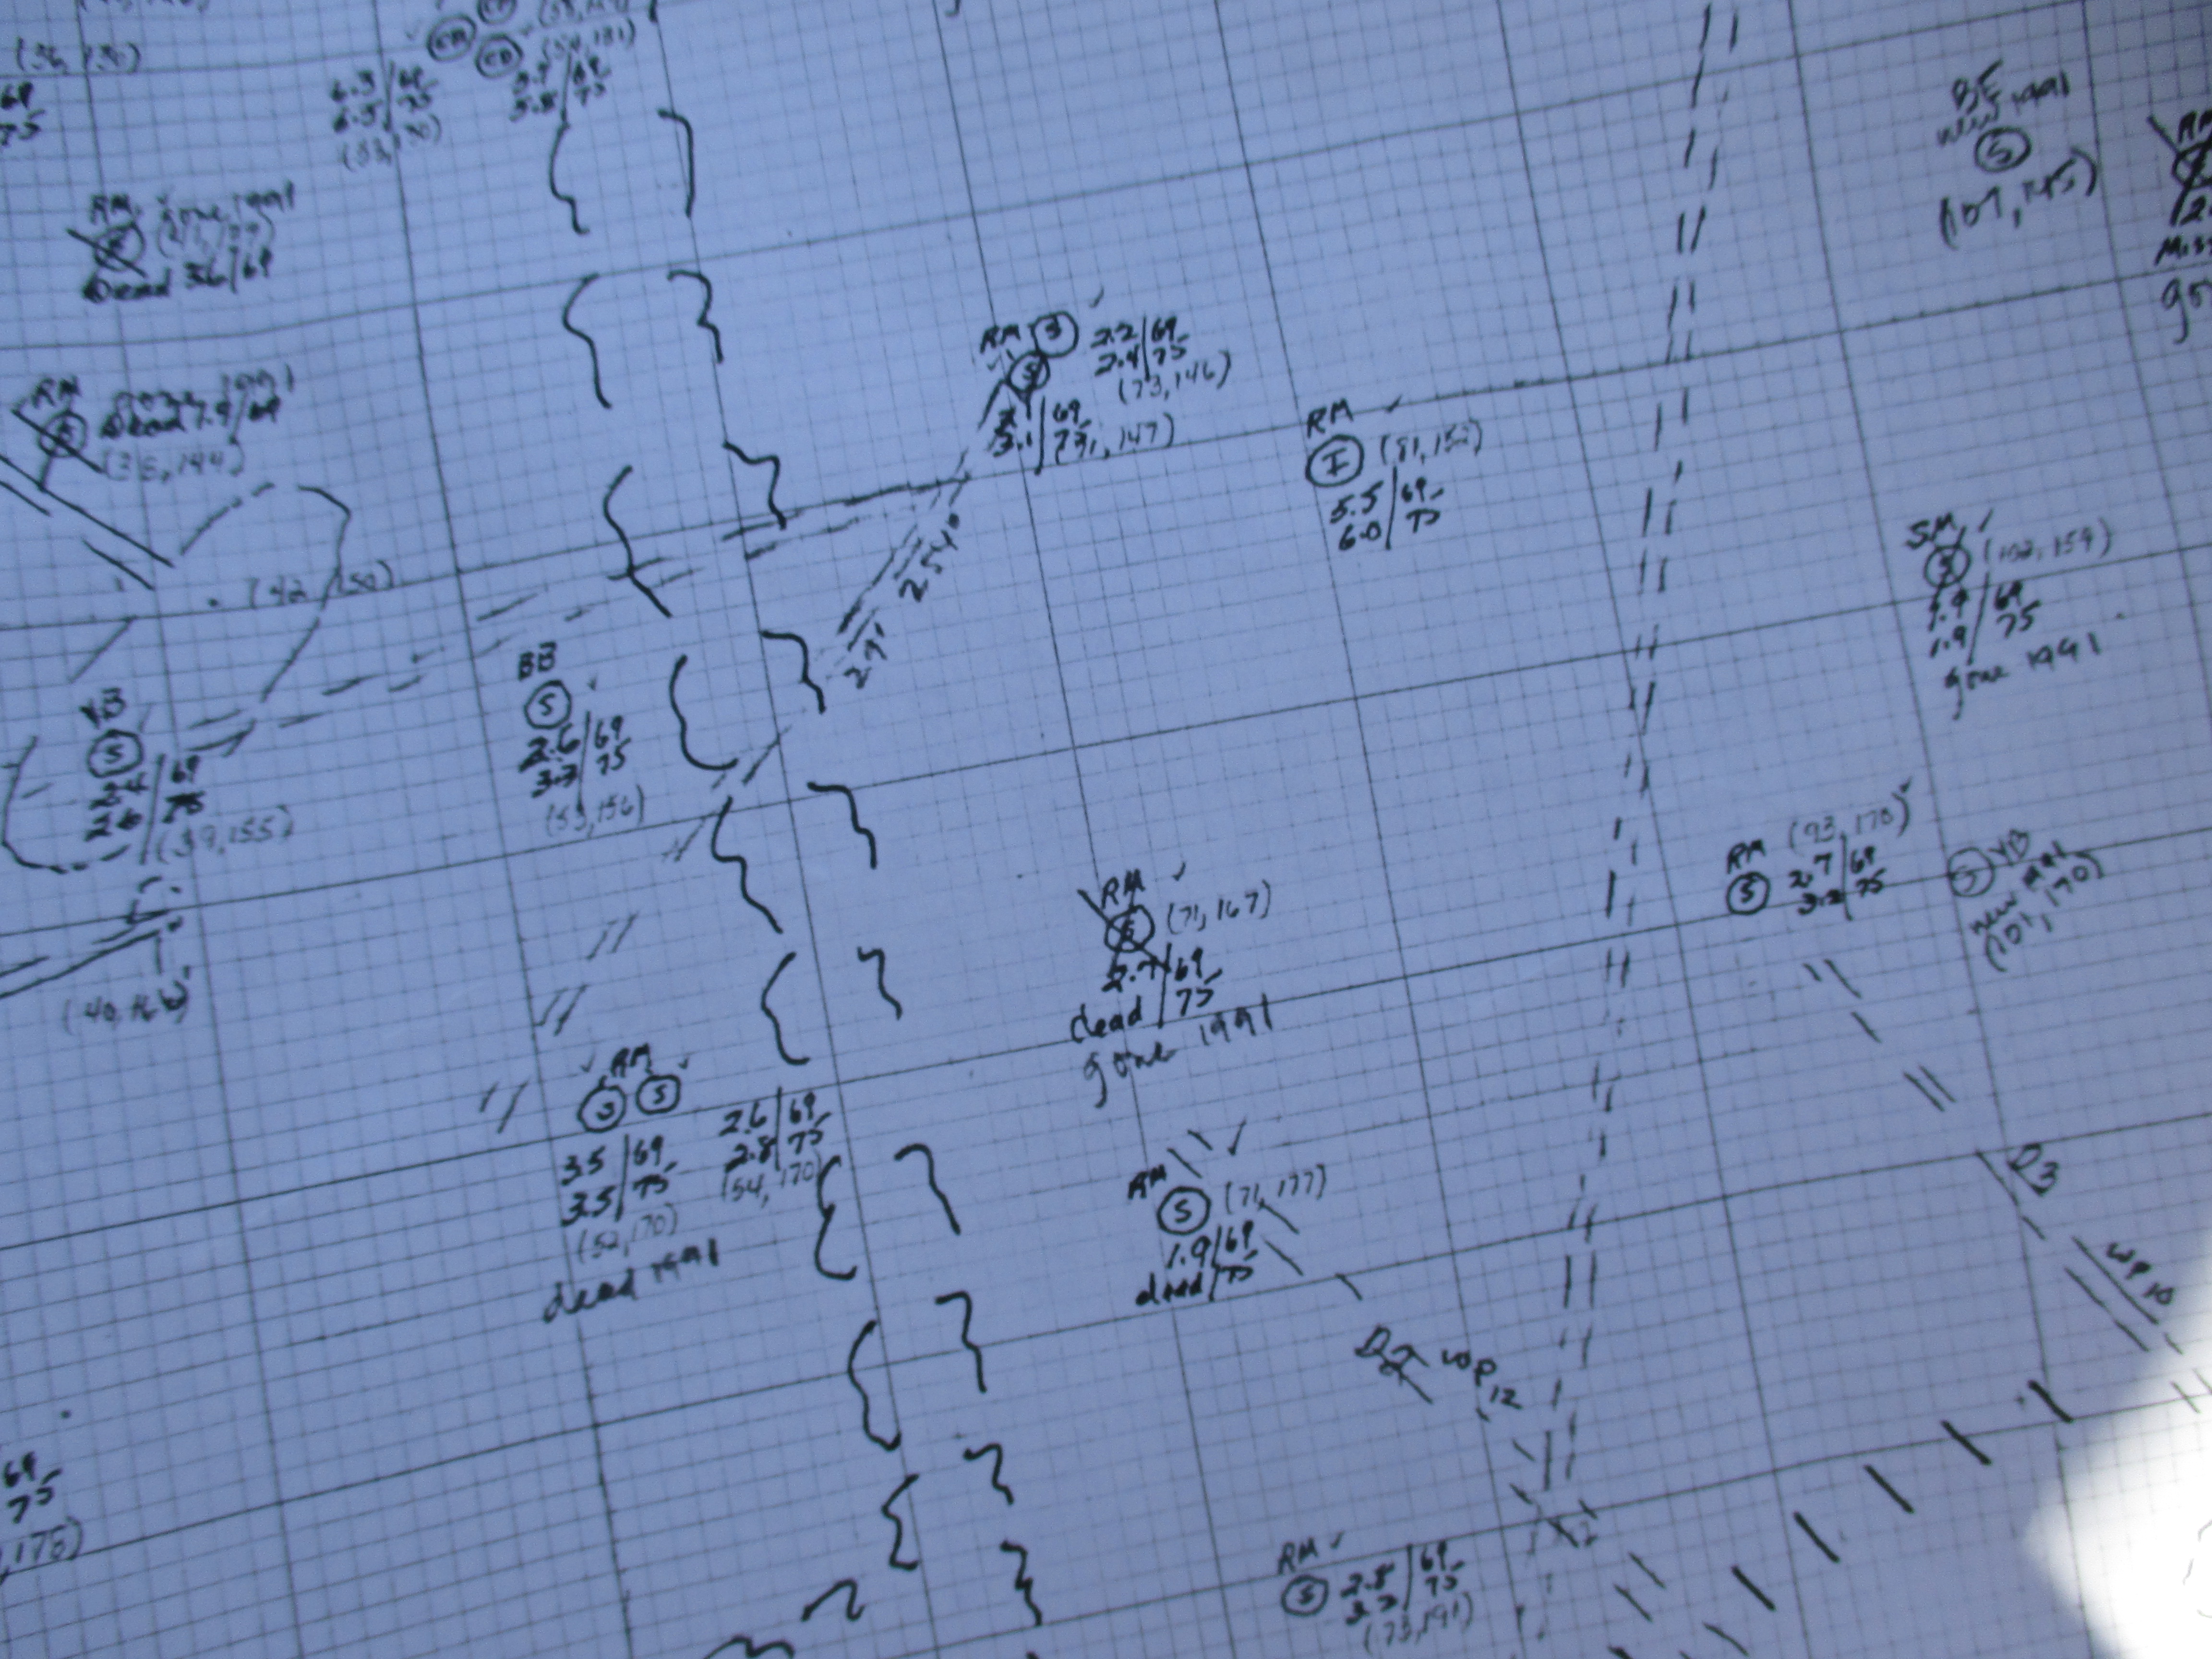
In a Google world Walter Lyford’s hand-drawn map meticulously noting the features of his study plot is a treasure of detailed, place-specific information.
Barker Plotkin and Kate Eisen of Cornell University – who did her work as part of the undergraduate research program in ecology at the Harvard Forest — published their results in the Journal of the Torrey Botanical Society today. The paper documents their analysis of a 2011 resurvey of the 6,000 trees in the Lyford plot, showing the trees in this mostly 110-year old stand are still growing – especially red oak.
From 1969 to 2011, red oak increased its dominance in this grove to clock nearly 70 percent of the total tree biomass. Meanwhile red maple receded to a lesser presence, as red oak asserted itself over the maple canopy.

Barker Plotkin checks Lyford’s map to locate two individual trees, using the handy desk of a stone wall — also on the map, of course.
On our walk, Barker Plotkin and I used a Xeroxed portion of Lyford’s map to find a classic example of this dynamic. She unrolled the map on a boulder (also on the map) and crooked her head back to point out a pair of trees, one a big red oak, and the other a red maple tucked under its canopy.
“If you want to see how great oak is, this is a pretty good place,” she said. Both trees had been measured and mapped in Lyford’s original survey. That enabled Barker Plotkin to see the maple had grown half as much as the oak over the 40-year period. And the oak were still surging ahead.
That’s the small, two-tree picture, but the value of it is that these two trees, watched over time, tell a planetary story. The tale of two reds – red maple and red oak – revealed by the long term research plot is that in the absence of some sort of major wipe out storm or other disturbance, red oak will continue to increase in size, and the stand will keep packing away the carbon it pulls out of the atmosphere for at least another century.
Red oak is the workhorse of the forest: its biomass more than doubled in the intervening years since Lyford’s initial mapping – compared with a 48 percent increase in all the other species. Part of the surprise in the data was how strongly red oak is still growing, even past its 100th year. It could even keep right on going, barring as storm or other major disturbance, maintaining their dominance and packing away carbon into their 200th year and beyond.
These oaks are literally eating into the carbon dioxide emissions people are putting into the atmosphere. Trees use carbon dioxide for their food source, to create sugar using the energy of the sun in the process of photosynthesis. Every atom of carbon a tree takes out of the air and tucks away in the form of wood, leaves or roots is that little bit less carbon in the atmosphere, trapping heat energy that’s changing the seasons, and the climate.
But just how is it that red oak dominates its grove? Partly, it’s red oak’s style. In a forest, red oak grows in a straight shot to the canopy then spreads a large crown with big strong branches. Red maple takes a more bulbous, contained form. The red oak simply overshadows it – literally. Researchers in the Richardson Lab at Harvard University have also found red oak is honing its performance in response to higher carbon dioxide levels and longer growing seasons caused by global warming. Red oak is increasing both its water use efficiency, and growth.

Audrey Barker Plotkin heads out to the Lyford plot at the Harvard Forest, with a photocopied section of Lyford’s map.
I am studying a big oak at the Harvard Forest that’s a textbook example of the red oaks in the Lyford plot. While not in the same part of the forest, its life story is the same: it sprouted in what was a pasture cleared by Europeans from the original forest. The pasture was abandoned in about 1840, and then grew in to white pine, cut intensively in the late 1890s. The oak I study today is part of the mixed-hardwood forest that came in after the pine was slicked off around 1900. It’s the third growth forest that comprises most of the Harvard Forest today – and red oak is its dominant tree.
Red oak’s witness and role as the industrial economy roared to life, and people left these pastures and farmlands to grow back to woods is the story I tell in my forthcoming book, Witness Tree. It’s a story about not just one red oak, but our relationship with nature, and the role of trees in our changing world.
Leave a Reply